This service is the simplest way to put in place professional credit risk analysis. No implementation lead time, no personnel costs, no office space. You receive grounded credit conclusion against fixed fee.
Furthermore, it takes care of our work s clarity. It gives an idea of how much money a company may credit to a specific counterpart. This approach makes credit decision-making simple, clear and trustworthy. Sales and marketing can discover opportunities while finance can keep risks under control.

FOCUS ltd.
London, United Kingdom
Summary
Stable sales turn over good performance of all the basic ratios characterize customer as financially stable with low probabillity of default in the nearcoming 12 months. Though profitability remains relatively low, growth over the last year gives good prospectives to in the nearest future. Taking also into account low level of indebtedness, unsecured transaction is permissible within the amount of calculated Creditworthiness.
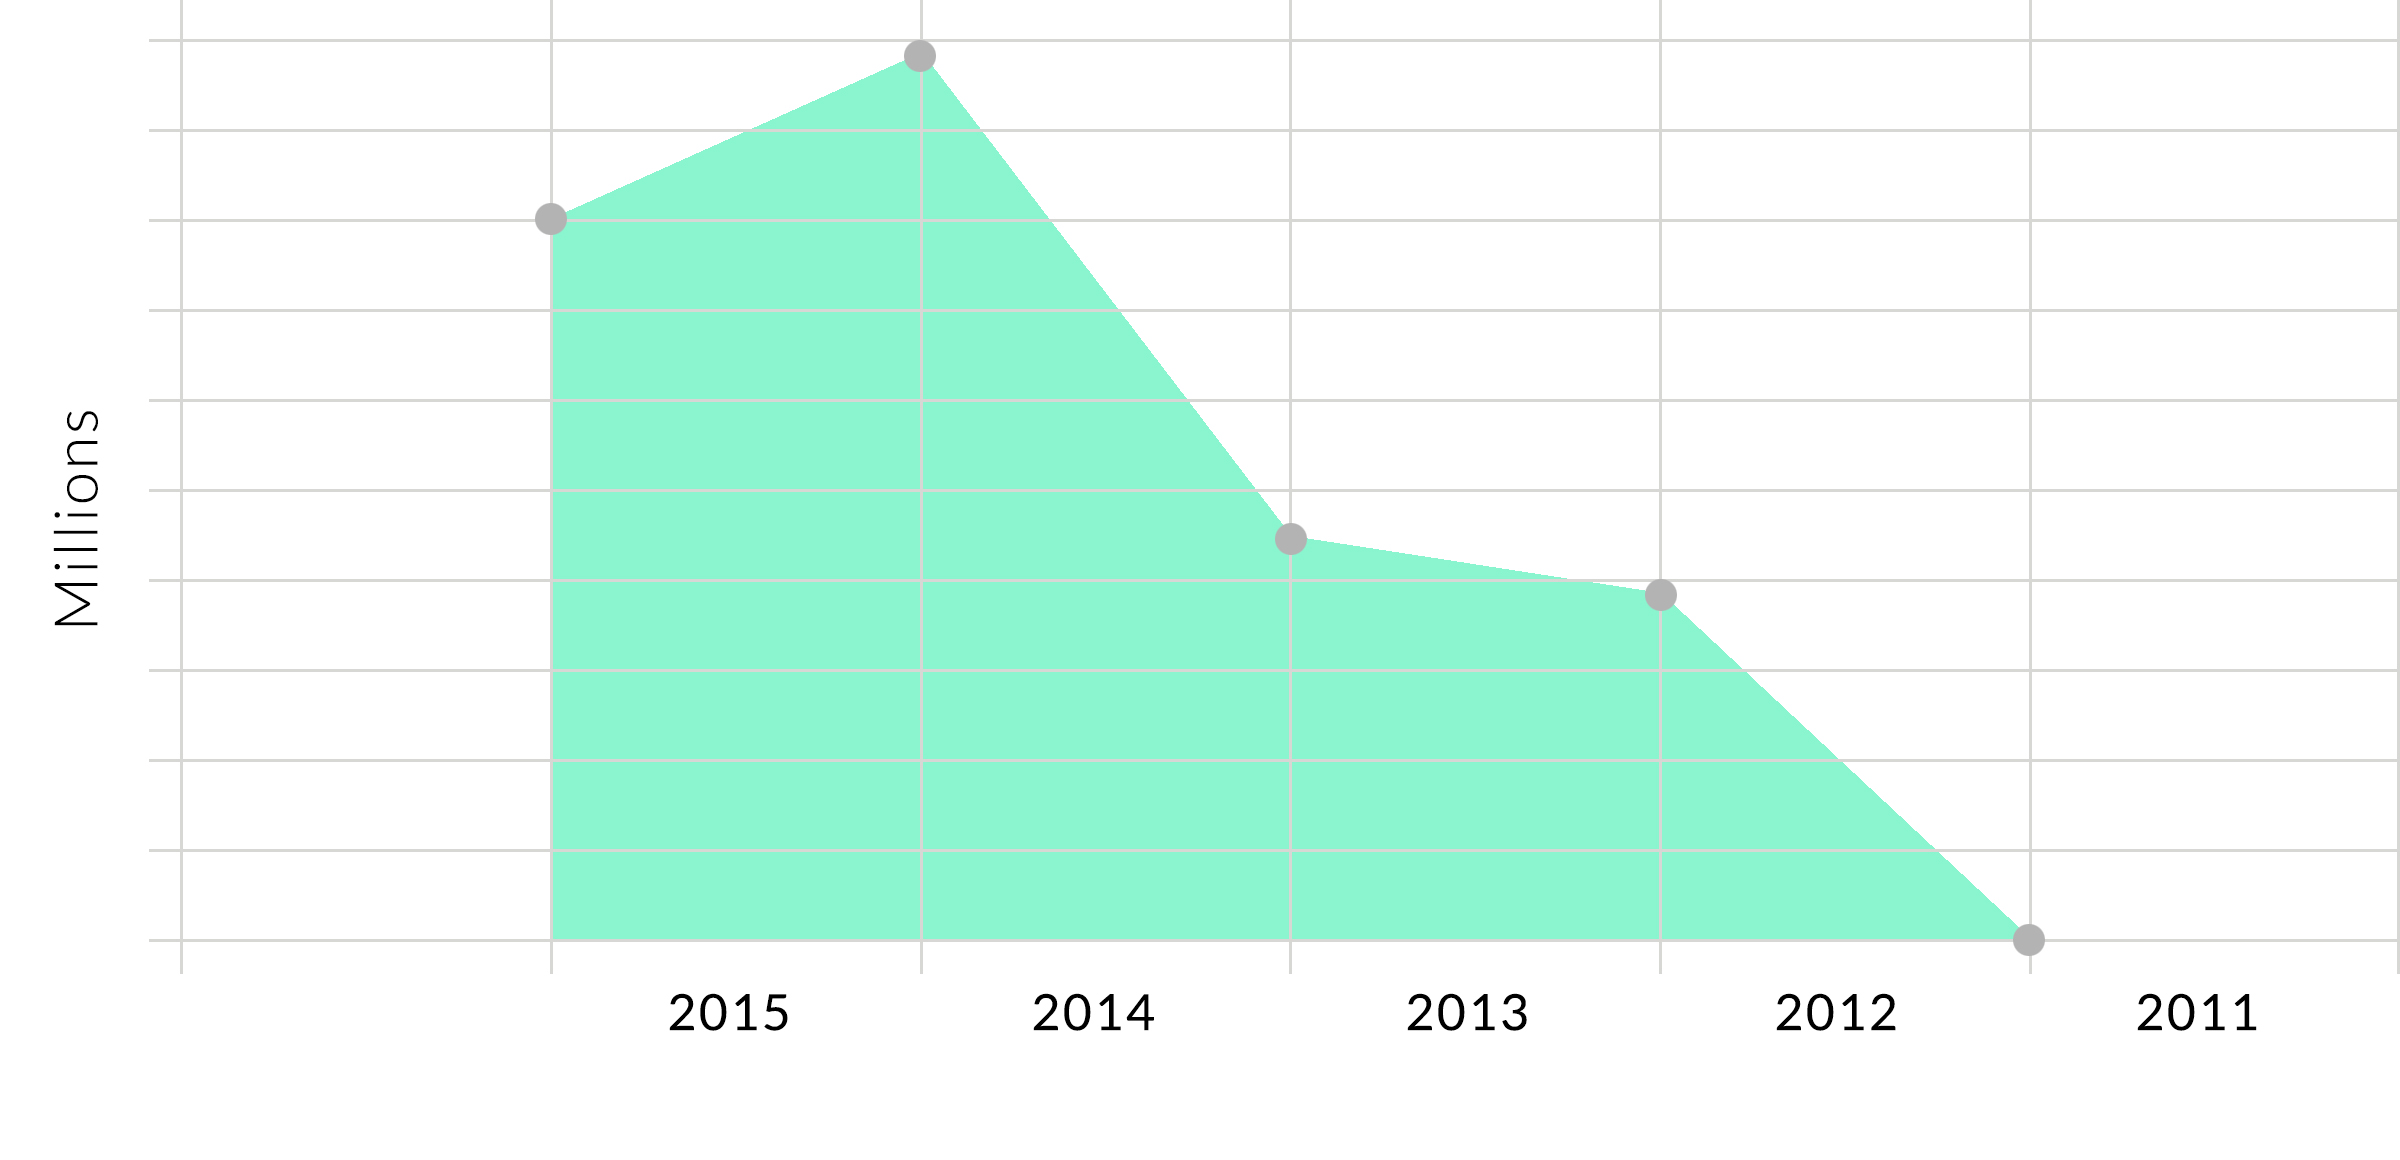
| 2015 | 2014 | 2013 | 2012 | 2011 | |
| Group | A | A | B | B | C |
| Creditworthiness | 188 065 | 239 627 | 107 930 | 91 511 | 0 |
 |
|||||
| 2015 | 2014 | 2013 | 2012 | 2011 | |
| Current | 2.0 | 1.6 | 1.4 | 1.2 | 0.9 |
| Quick | 1.0 | 0.9 | 0.8 | 0.7 | 0.5 |
| Debt/Equity | 0.6 | 0.7 | 0.9 | 1.1 | 1.5 |
| ROE | 20% | 12% | 8% | 11% | 9% |
| ROS | 3% | 3% | 1% | 2% | 1% |
| Z SCORE | 6.5 | 5.1 | 4.7 | 4.6 | 4.5 |
| 2015 | 2014 | 2013 | 2012 | 2011 | |
| Assets | |||||
| cash | 401 | 576 | 681 | 651 | 420 |
| receivables | 393 | 332 | 232 | 270 | 256 |
| inventories | 721 | 738 | 719 | 665 | 636 |
| Current Assets | 1 516 | 1 647 | 1 633 | 1 587 | 1 313 |
| Fixed Assets | 400 | 749 | 717 | 642 | 740 |
| Other Assets | 141 | 293 | 320 | 297 | 310 |
| Total Assets | 2 057 | 2 691 | 2 671 | 2 527 | 2 363 |
| Liabilities and Net Worth | |||||
| bank loans | 179 | 289 | 434 | 506 | 486 |
| paybales | 589 | 721 | 719 | 765 | 917 |
| Current Liabilities | 768 | 1 010 | 1 154 | 1 271 | 1 404 |
| other | 35 | 83 | 78 | 35 | 5 |
| Total Liabilities | 803 | 1 093 | 1 232 | 1 307 | 1 409 |
| Net Worth | 1 253 | 1 597 | 1 439 | 1 220 | 954 |
| Total Liabilities and Net Worth | 2 057 | 2 691 | 2 671 | 2 527 | 2 363 |
| Income Statement | |||||
| Turnover | 7 844 | 7 685 | 7 510 | 7 668 | 7 603 |
| Gross Profit | 1 455 | 1 454 | 1 391 | 1 382 | 1 338 |
| Earnings before Income taxes | 313 | 244 | 144 | 163 | 227 |
| Net Income/Loss after taxes | 249 | 198 | 110 | 131 | 83 |